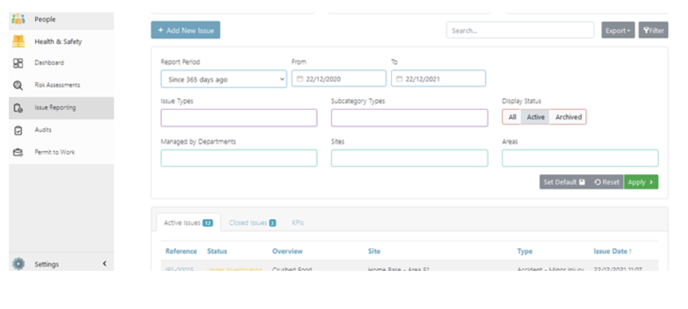
In the main Issue Reporting section, there are filters available to both filter the main tables and KPI graphs. Click the “Filter” button in the top right to show the filter panel (A). Primary filters include a date range and the report type, as well as filtering by sites and areas.
(A) Example Filters for KPIs
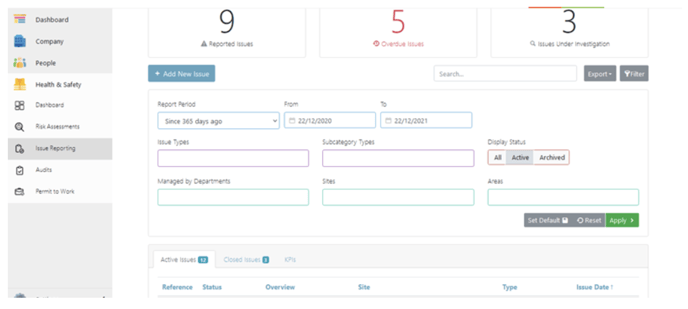
(A) Exporting Data
You can export the data into an Excel file by selecting the Export tab. You can use the filters to export the data you need or choose to export all.